Trade ladder and chart
The trade ladder shows one trade as a price rail: where you got in, where the stop and target sit, and what each level is worth. The chart draws the same levels on the candles, with indicators.
The trade ladder
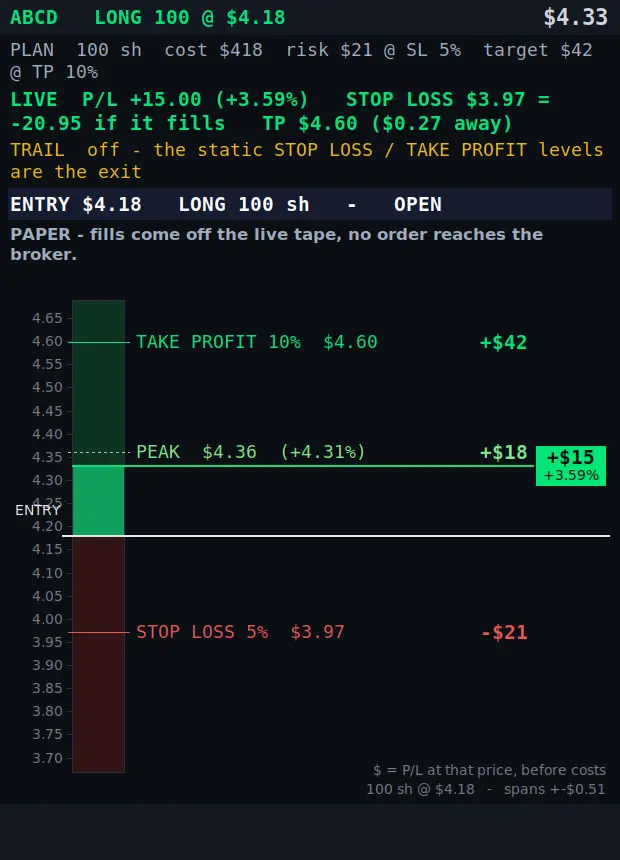
Press LADDER. One resizable window opens (pressing the button again brings it to the front). The ladder follows the armed stock's position on the main desk. With no position open it shows a plan preview: what the next BUY or SHORT would send, at your current size and exit settings. Fleet positions are not followed; the OPEN window lists those.
The ladder with a trailing stop
Switch Trailing TP/SL on and the ladder shows the trail in whichever of its two states it is in. Both are below; the rules themselves are on the exits and risk page.
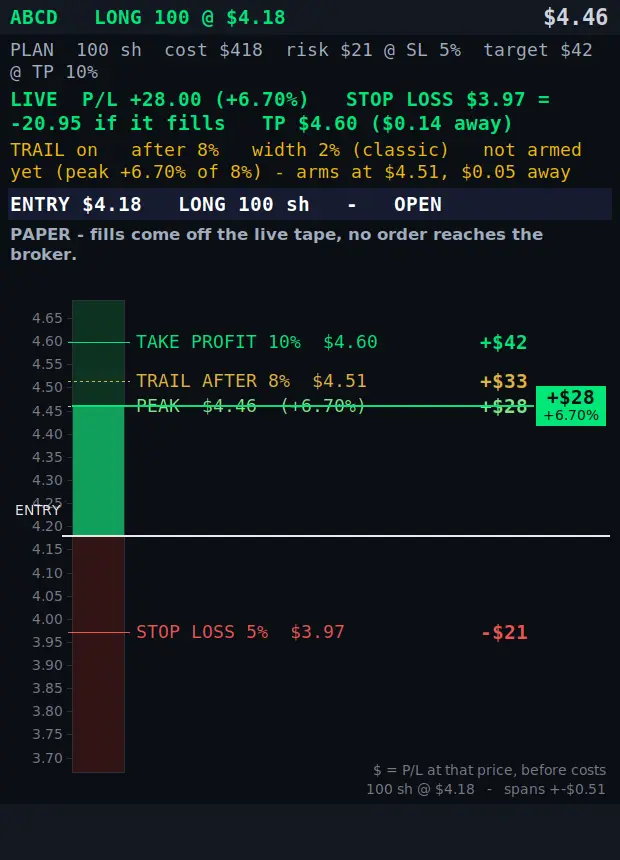
Waiting - the TRAIL AFTER rail
Until the trade reaches Trail after, nothing is trailing. The threshold is drawn as a dashed TRAIL AFTER rail between the peak so far and the take profit, and the TRAIL row says how far off it is. The static STOP LOSS is still the exit, and is still drawn.
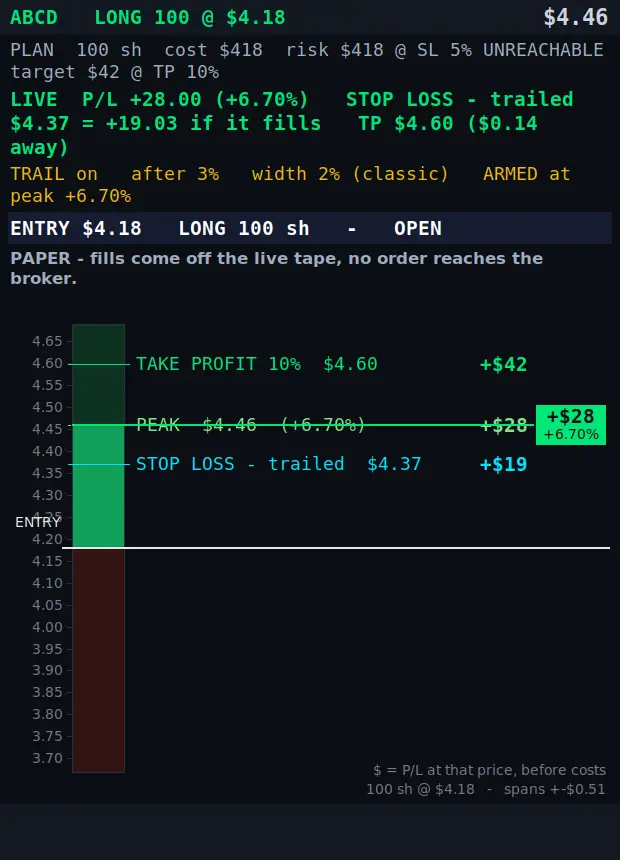
Running - the trailed stop
Once the threshold is passed the TRAIL AFTER rail is gone and a cyan STOP LOSS - trailed rail takes its place, following the peak at your Trail width (or the step lock, if a step % is set). When that trailed stop is more protective than the stop loss you set from entry, the original is marked UNREACHABLE and is no longer drawn - the trail would always get there first.
Ladder information rows
| Row | What it shows |
|---|---|
| Head | The stock, side, shares and entry price, with the live price on the right. |
| PLAN | Shares, cost, the dollars at risk to the stop loss and the dollar target at the take profit. |
| LIVE | The open profit or loss in dollars and percent, what the stop loss would realize if it fills there, and how far the take profit is. |
| TRAIL | Whether a trailing stop is off, waiting or running, and which rule is in charge. |
| ENTRY | The entry, side and shares, and whether the trade is OPEN or, in a plan preview, ready to be executed. |
| Warnings | Anything you need to know about this trade, such as paper mode ("fills come off the live tape, no order reaches the broker"), or exits being switched off. |
| CLOSED | After a trade closes: how it closed and the result including commission. |
The rail and its levels
The entry is the white line across the centre. The rail is green on the side where the trade makes money and red where it loses. A price column runs down the left, and a chip on the right shows the live profit or loss in dollars and percent.
Each level is a labelled line with its dollar value in the column on the right: the profit or loss at that price, before costs.
| Level | Meaning |
|---|---|
| TAKE PROFIT | Where the take profit exit sits. |
| STOP LOSS | Where the stop loss exit sits. |
| TRAIL AFTER | How far in profit the trade must go before the trailing stop starts. |
| TRAIL STOP | The live trailing stop once it is running. It only ever moves in your favour. |
| NEXT STEP | With a step lock, the price where the stop moves up (or down, for a short) one more step. |
| PEAK | The best price the trade has reached since entry. |
| HARD STOP | A fixed stop price set by an entry rule, for example over the high on a retest short. |
| RESTING | The resting rail for a manual limit entry, when it is on. |
If exits are switched off for that side, the ladder says so in red: nothing will fire.
Dragging levels
Hover over TAKE PROFIT, STOP LOSS, TRAIL AFTER or RESTING and drag it up or down. A dashed preview line follows the mouse; release to set the new level.
- Dragging take profit, stop loss or trail after changes that side's setting, the same number you see in the AUTO/BOT window (it is one setting, not a copy).
- Dragging the resting rail sets its price, and turns it on.
- A take profit behind the entry or a stop in front of it is refused, and the order log says why.
The chart
Press CHART. The chart opens in a browser window, drawn by TradingView's Lightweight Charts. It follows the same stock as the ladder and draws the ladder's own levels, so the two always agree. It runs in the browser, separate from the trading engine, so the engine never waits for it.
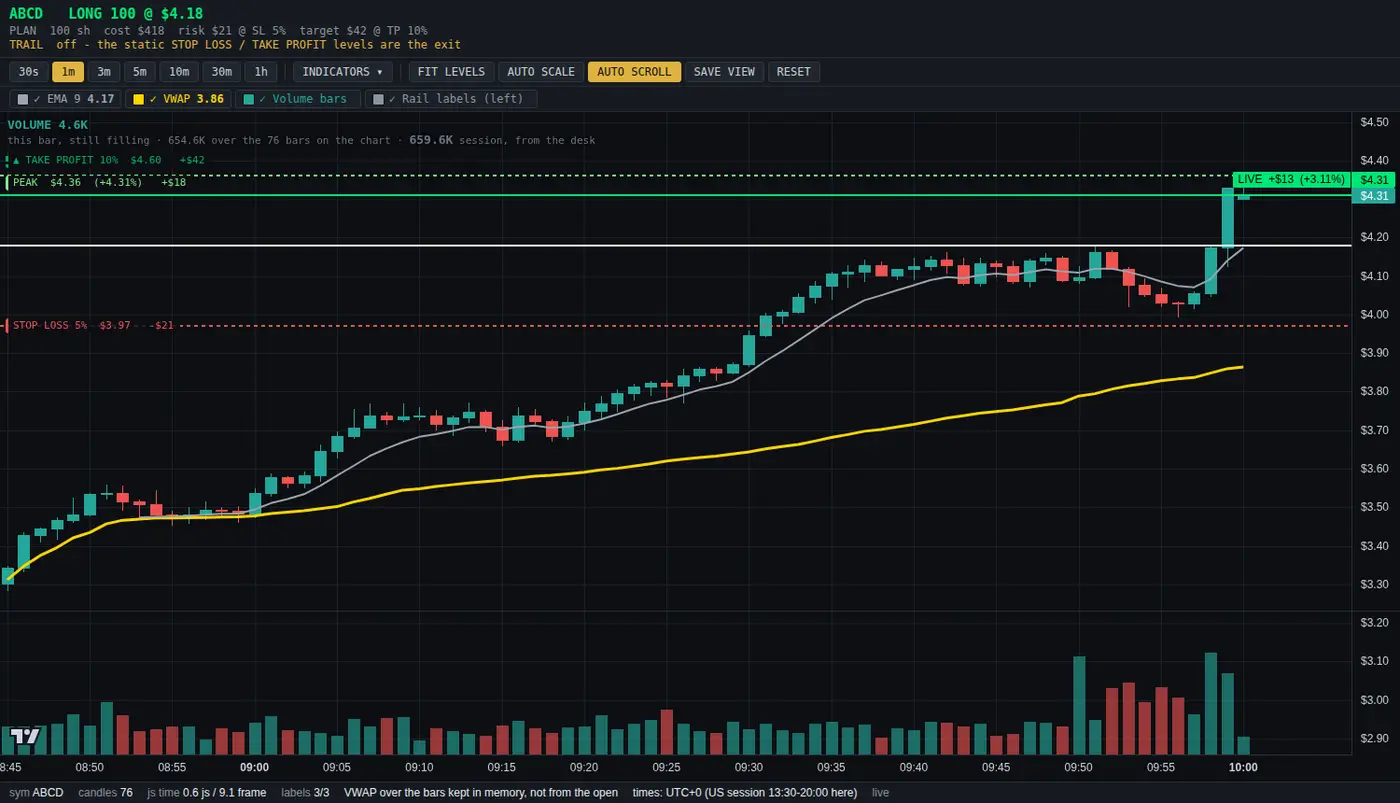
- The top lines repeat the ladder's plan and trail status.
- Level names sit on the left of the chart; the live price line on the right carries the open profit or loss.
- Volume bars run underneath, coloured with their candles. The volume line above the chart shows the current bar's volume.
Chart controls
| Control | What it does |
|---|---|
| 30s … 1h | Candle timeframe: 30 seconds, 1, 3, 5, 10 or 30 minutes, or 1 hour. |
| INDICATORS | Opens the indicator picker (below). |
| FIT LEVELS | Includes every level in the price scale, so the plan and the price are in one picture even when the target is far away. |
| AUTO SCALE | On: the price axis follows the visible candles. Off: your own drag on the price scale stays put. |
| AUTO SCROLL | Keeps the newest bar in view as bars arrive. |
| SAVE VIEW | Remembers the timeframe, vertical zoom, FIT LEVELS, AUTO SCALE and AUTO SCROLL. |
| RESET | Goes back to the saved view. |
| Indicator chips | Each active indicator shows as a chip with its current value. Click a chip to turn that indicator off. Volume bars and Rail labels (left) can be switched off the same way. |
Indicators
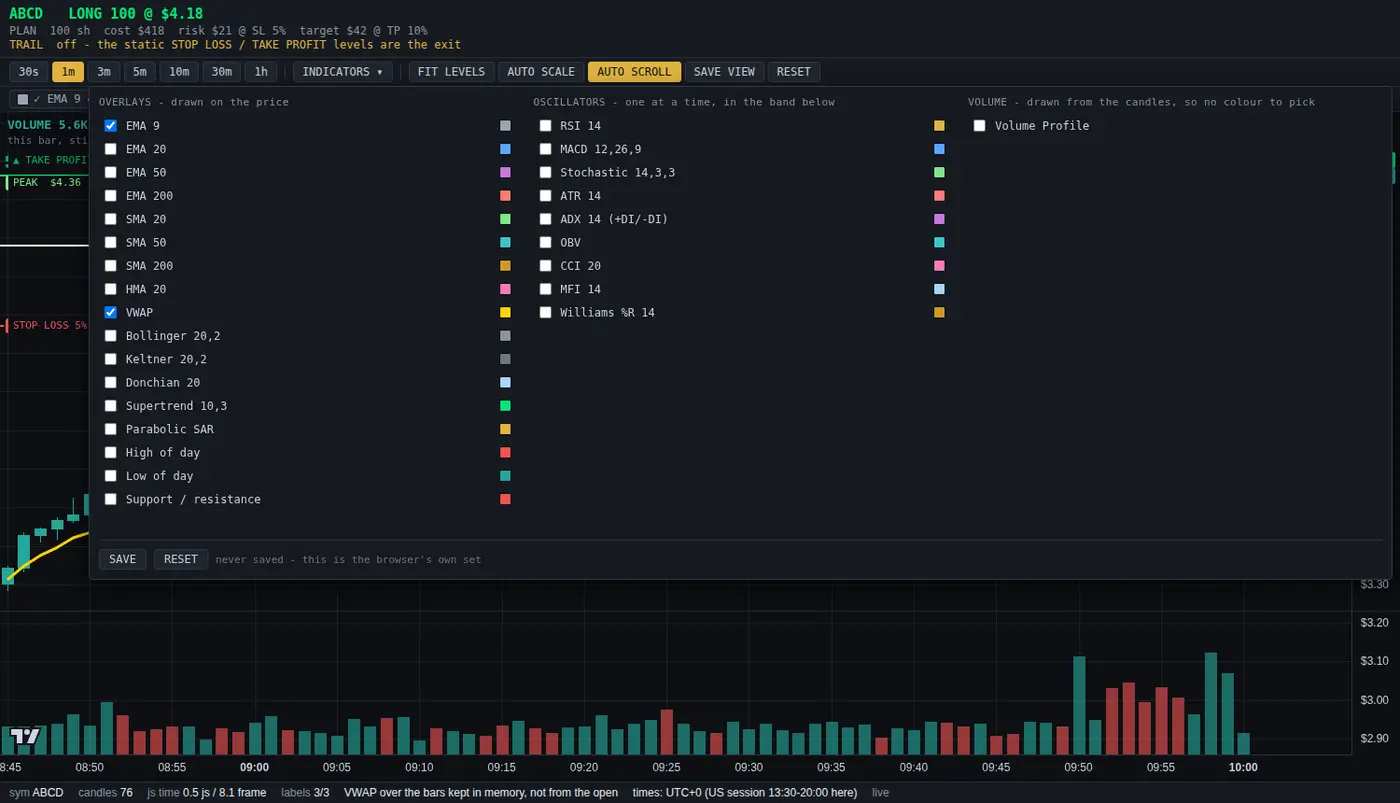
Tick an indicator to draw it; click its colour square to pick a colour. Indicators are calculated in the browser from the bars the desk sends.
| Group | Indicators |
|---|---|
| Overlays | EMA 9, EMA 20, EMA 50, EMA 200, SMA 20, SMA 50, SMA 200, HMA 20, VWAP, Bollinger 20,2, Keltner 20,2, Donchian 20, Supertrend 10,3, Parabolic SAR, High of day, Low of day, Support / resistance. Any number can be on together. |
| Oscillators | RSI 14, MACD 12,26,9, Stochastic 14,3,3, ATR 14, ADX 14 (+DI/-DI), OBV, CCI 20, MFI 14, Williams %R 14. One at a time, in a band under the price. |
| Volume | Volume Profile. |
Your choices are kept by that browser. SAVE in the picker also saves them on the desk, so a new session opens with them; RESET goes back to the set the desk has saved.
What the chart needs and its limits
- The chart is served on
127.0.0.1: your own computer only, nothing is exposed to the network. - The first press downloads the chart library once; after that it is kept next to the program and used offline.
- You can choose which browser opens it (Chrome, Edge, your default browser, or a program path) in the settings file.
- The desk keeps a limited amount of recent history per stock, so long indicators such as EMA 200 cannot draw on every timeframe. When there are not enough bars, the chip says
(no line here)instead of drawing a misleading line.