Journal and analysis
Every fill, every closed trade and every order attempt is recorded. The header, the trade windows and the order log show today; JOURNAL and ANALYSE look back over days, sessions and profiles.
Realized net
REALIZED NET in the header is today's closed profit or loss after costs, for the mode the desk is in: PAPER while paper trading is on, LIVE when orders go to your broker. Under it: the gross result, the costs (commissions, fees and locate costs), and today's trade count. The other mode is never mixed in; JOURNAL shows each on its own.
OPEN, on the right of the header, is the profit or loss on positions still open.
Closed trades
The CLOSED window lists the session's closed trades, newest first.
| Column | Meaning |
|---|---|
| Time, Sym, Side, Sh | When, which stock, long or short, and shares. |
| Entry, Exit | Entry and exit prices. |
| Gross, Costs, Net, Net % | The result before costs, the costs, the result after costs, and net as a percentage. |
| Sess | The session it traded in. |
| Profile | The profile it traded under (Manual for your own orders). |
| Reason | Why it closed: for example your manual close, the take profit, stop loss or trailing stop. |
Open positions are in the OPEN window.
Order log and executions

- Order log (left): what happens to your money, newest on top - every order sent, every fill, every refusal and cancel, exits, halts, locates, risk, arming, and paper or live. News for your symbols appears here too. A warning or a failure always appears, whatever it is about: a ladder price that would not move, a shortcut that could not be saved.
- EXECUTIONS (right): every fill as it happens: time, side, quantity, symbol, price, net, and the profile, source and exit reason.
show everything
The desk also writes its own bookkeeping - the market sweep's counts, calibration, why a symbol was skipped, profile migrations, startup checks. That belongs in a file, not in front of you while an order is working, so it is kept off this pane. Tick show everything above the log to put it back on screen, and untick it to go back to the order path.

Nothing is ever lost. orders.log beside the program carries every line whichever way the tick is set, so what was sent and what came back can always be checked later.
How long an order actually took
Every order writes an EXEC TIMING line: how long your broker took to answer, how long until the fill was seen, and how long the broker itself took from receiving the order to filling it. It is the desk's own bookkeeping, so it appears with show everything ticked - and it is always in orders.log.

| Line | What it tells you |
|---|---|
| SEND | The order as it left the desk: side, size, symbol, order type and price, the exact parameters, and the broker call used. |
| PendingNew | The broker has the order and has given it an id. The desk is now waiting for the fill. |
| FILLED | The fill, at the price that was actually paid - not the limit that was asked for. |
| EXEC TIMING | Three separate measurements. Broker answered in is your round trip to the broker. Fill seen ... after send is the whole thing end to end, and says where the fill came from (the fill stream, or polling). At the broker submitted to filled is the broker's own part, which is the only part of it that is not your connection. |
| PRE-ENTRY | Written after the trade, if Record the minute before each entry is on: how long the move had already been running when you got in, and how many tape prints were kept for the report. |
These are milliseconds on a working connection, and they are worth reading after a bad fill: a slow broker and a slow line are different problems, and the line above separates them.
The JOURNAL window
Press JOURNAL. The journal shows your closed trades by day on a month calendar, with a summary, the day's trades, a per-profile table and notes.
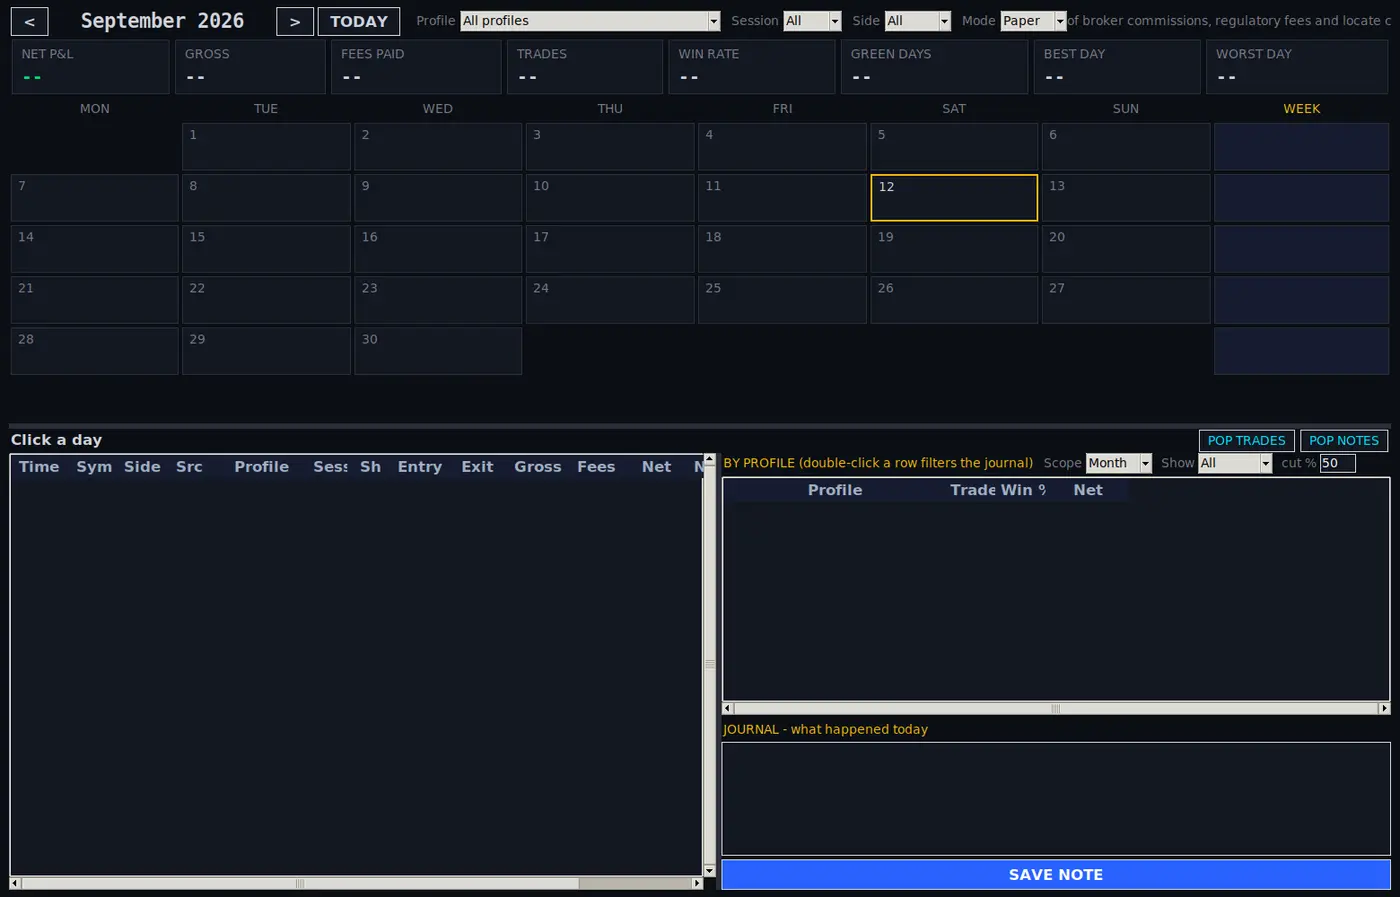
| Part | What it does |
|---|---|
| < > TODAY | Previous month, next month, and back to today. |
| Profile, Session, Side | Show only trades under one profile, in one session (premarket, market or after hours), or on one side. |
| Mode | Which journal: real money or paper. They are never mixed. |
| Summary strip | For the month and filters shown: net result, gross, fees paid, number of trades, share of winning trades, days with a net gain, and the best and worst day. |
| Calendar | Each day shows its net result and trade count; the WEEK column totals each week. Click a day to see its trades. |
| Day trades | Every trade on the chosen day with time, symbol, side, source, profile, session, shares, entry, exit, gross, fees and net. |
| BY PROFILE | Results per profile. Scope covers the day, week or month; Show lists all profiles, or only the winners or losers, split at the cut % share of winning trades. Double-click a row to filter the journal to that profile. |
| JOURNAL notes | A notes box for the day; SAVE NOTE keeps it. |
| POP TRADES, POP NOTES | Open the day's trades or notes in their own window. |
ANALYSE
Press ANALYSE. It ranks every profile by what it actually made, from every journal at once (real, paper, the fleet and any journal you add), kept apart by mode.
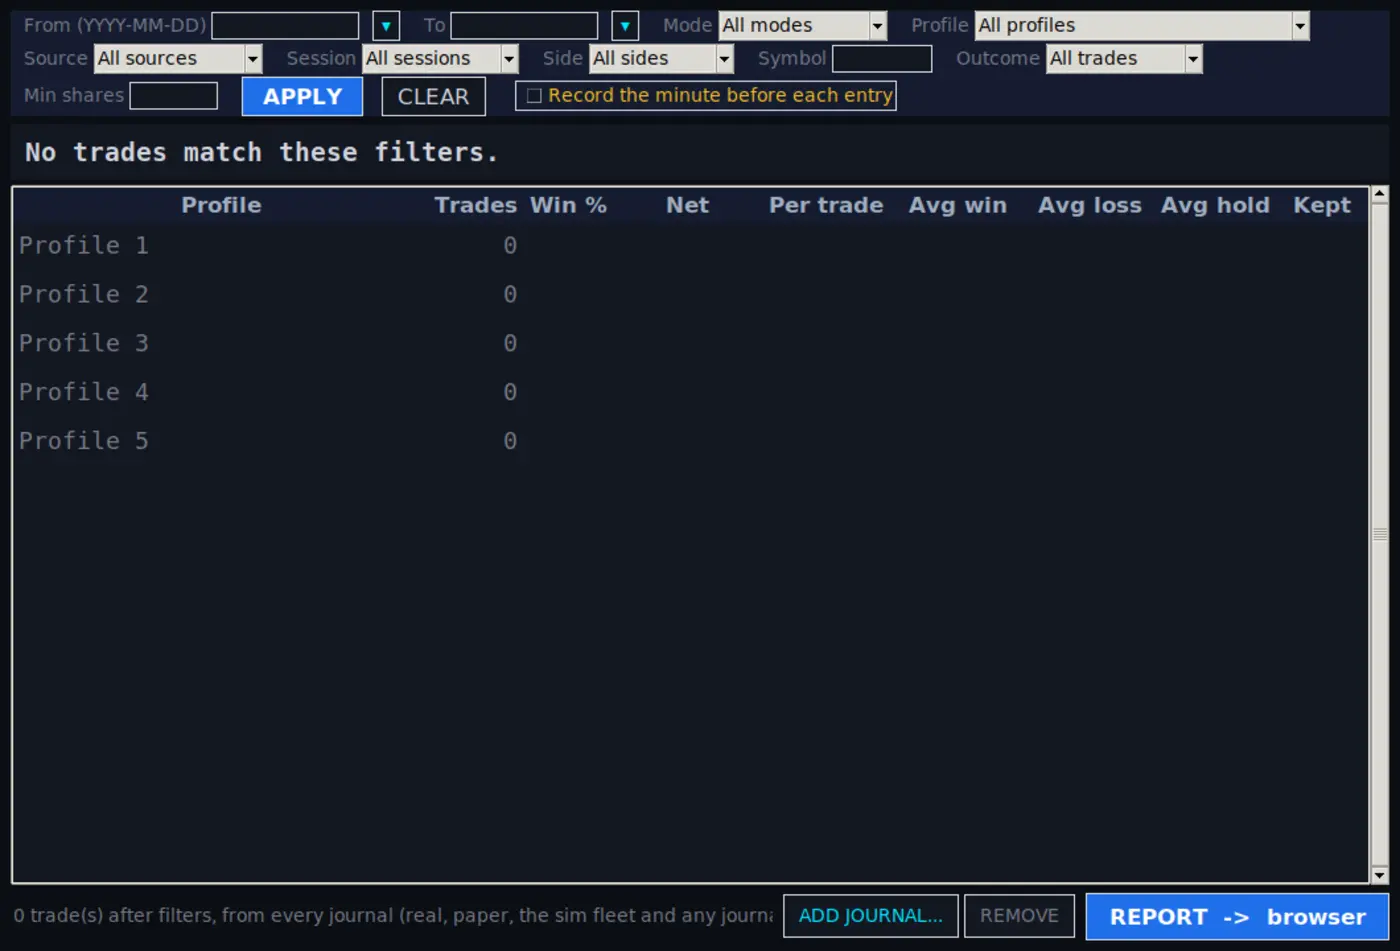
- Filters: a date range (each box has a calendar picker), mode, profile, source, session, side, symbol, outcome (winners or losers) and minimum shares. APPLY runs it; CLEAR resets every filter.
- Profile table: trades, share of winners, net, average per trade, average win, average loss, average hold time, and Kept (how much of the best move the trades reached was kept). Every profile is listed, so one that traded nothing shows zero. Click a heading to sort.
- Double-click a profile to see the trades behind it; press Escape to go back.
- ADD JOURNAL... adds another journal file (for example from another computer or an export) with its own mode label. REMOVE takes an added journal out of the analysis; the file is not deleted.
- Record the minute before each entry (off by default): when a position closes, the desk fetches the minute of trades before its entry and adds it to the trade's report, showing when the move started and how late the fill was. It runs after the exit, never on the order path.
Reports
REPORT -> browser writes a single self-contained web page of what is on screen, with charts, beside your data, and opens it in your browser, to keep or share. With one trade selected it writes that trade instead: where you got in and out, how far price went either way, the take profit and stop loss the trade was running, and the five minutes after the exit.
Where it was executed
The heart of a single-trade report is one picture: the minute before your entry, the whole time you held it, and the five minutes after you were out, drawn on one price axis so they can be compared directly.
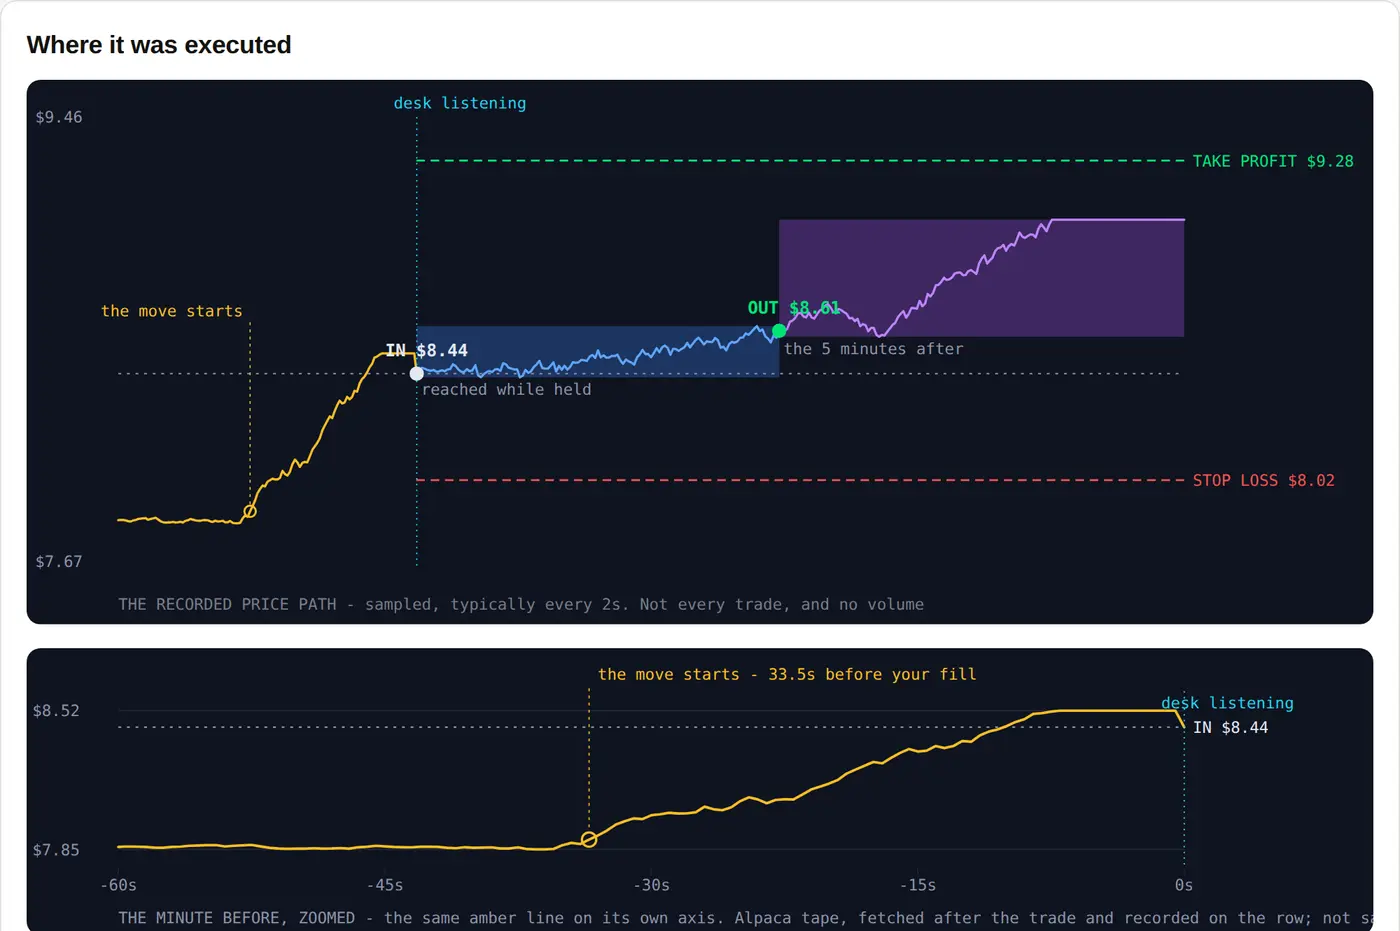
| On the picture | What it is |
|---|---|
| Amber line - the minute before | The last 60 seconds before your fill. It is not the desk's own sampling: it is the tape from your broker, fetched after the trade closed, so it is what the market printed rather than what the desk happened to see. the move starts marks where it left its quiet level, and the picture says how many seconds before your fill that was. |
| Blue line - while you held it | The recorded price path between IN and OUT: the route, not a summary. It is sampled (typically every 2 seconds), so a spike between two samples is not on it; the footer says how often. |
| Blue band | The full extent price reached while you held - measured on every sample, so it can sit wider than the line. |
| Purple line - the five minutes after | What the stock did after you were out, drawn across the whole five minutes. This is the one that answers "should I have held?". |
| TAKE PROFIT / STOP LOSS | The levels that trade was actually running, dashed across. They are drawn only from your entry onwards - they did not exist before you were in. |
| desk listening | The dotted line marking when this desk started receiving the symbol. Anything to the left of it printed while the desk was not subscribed: it could not have been traded, however good it looks. |
| The faint dashed line | The price you paid, carried back across the minute before - what turns "the line was down there" into "it was down there relative to my fill". |
| The second panel | The same amber minute on its own axis, so the build-up before your fill is readable instead of a flat line at the bottom of the trade. Nothing in it is re-measured. |
Read together they answer the two questions a fill raises: was I late (how much of the move had already happened before the amber line reaches your entry) and was I early out (where the purple line goes after the exit). The minute before is only recorded when Record the minute before each entry is switched on in ANALYSE; without it the report still draws the held route, the levels and the five minutes after.
SYNC BROKER
SYNC BROKER (it carries your broker's name) imports trades you placed directly in your broker's own platform into the real journal. The desk's own fills are already recorded and are skipped, so syncing again never duplicates a trade. Fees are not imported; your broker's statement remains the record of money.
EXPORT
EXPORT writes a zip of the day's logs, journals and settings beside the program: everything needed to look into a session later. Nothing is uploaded anywhere.
Paper and live are kept apart
- In paper, your trades and the fleet's go to the paper journal. Live trades go to the real journal. With the desk live, fleet slots that are not ticked LIVE keep their own fleet journal, and a LIVE slot's real fills are booked in the real journal.
- The header's realized net, the journal's Mode filter and ANALYSE's mode column always keep them separate.
- Costs in the journal come from the commission schedule you enter in the BROKER window, so keep it up to date.