Scanner and market lists
The scanner watches the live market and lists the stocks that pass your filters. The gappers, watchlist, new highs and news windows give you more views of the same market.

Filters row
The filters row sits under the header. It applies to the scanner and to the top gappers list, and every automatic entry must also come from a stock on the scanner.

| Setting | What it does |
|---|---|
| Window | The time window the scanner measures volume, relative volume and the price run over. Choices: Candle 30s, Candle 1m, Candle 5m, Candle 10m (whole candles), 1m, 5m, 10m, 1h (rolling windows) and 1D (the session). A shorter window reacts faster and reads noisier. |
| Price $ … to | The price band. Stocks below the first price or above the second are ignored. |
| Min gap % | How far above yesterday's close a stock must trade to enter the scanner. 0 means no gap floor: more stocks, more noise. |
| Min vol K (win) | Volume in the selected window, in thousands of shares, that a stock needs to count as active. |
| Min RVOL (win) | Relative volume in the window, compared with the normal volume for that time of day. 2 means twice normal. Relative volume can read very high after a halt or a split. |
| Min RVOL day | A floor on today's pace against a normal day. 0 is off, 1 means at least normal pace. It filters out quiet stocks that spike for one minute. |
| Scans/sec | How often the market-data screener is asked for new movers. Higher finds a mover sooner and uses more of your data plan. Too high for your plan and the data provider stops answering, which makes the scanner blind, not faster. One value for the whole desk. |
Session sets: PRE, MKT, AH and auto
Premarket, market hours and after hours each keep their own filter values, because a stock that is interesting at 07:00 looks very different at 11:00.
- PRE, MKT and AH load that session's filters by hand (and turn auto off). Any change you make is saved into the set you are looking at.
- auto follows the market clock: the sets switch themselves at 09:30 and 16:00 New York time. At 16:00 the after-hours session also starts fresh, so first hits and new highs are counted again from zero.
Typing a ticker: WATCH / TRADE
The box left of WATCH / TRADE takes any ticker. Type it and press Enter (or the button): the stock is added to the scanner feed and armed for the BUY and SHORT buttons, the ladder and the chart. This is your way into a stock the filters did not surface.
The scanner
The scanner is a history board. Every alert is its own row with the newest on top, and rows stay where they are: nothing is overwritten. Click a row to arm that stock. Double-click arms it too; it only sends an order if you have ticked Double-click sends orders.
The scanner is always in the main window. The SCANNER button in the WINDOWS row opens a second copy in its own resizable window.
| Column | Meaning |
|---|---|
| Time | When the alert fired, on your computer's clock. |
| Symbol | The ticker. |
| Loc | How many locates (borrowed shares for shorting) you hold for this stock today; - for none. |
| High | The price when the alert fired. |
| Live (vs high) | The current price and how far it is from that alert price. Shows the halt state when the stock is halted (below). |
| Vol day | Shares traded today. |
| Vol win | Shares traded in the selected window. |
| RVOL win / day / 5m | Relative volume in the selected window, for the day's pace, and over the last 5 minutes. |
| Float (age) | An estimate of the shares available to trade, and how old the share count behind it is: 1.04M 33d. Read below — including why the age is part of the figure, and when the row turns red. |
| Gap % | How far the price is above yesterday's close. |
| Strategy | Which alert fired (below). |
RESET and HIST
- RESET clears the scanner's day state and starts fresh: the board, high-of-day marks, first hits, day and session volume and relative volume, on the main desk and the fleet. It then reloads yesterday's reference figures and rebuilds today. Positions, orders and the journal are never touched.
- HIST shows whether the scanner holds today's full price history for every stock it knows: green for complete, amber for loading or partial, red for poor. Click it to reload the whole day without clearing anything.
Alert types (Strategy column)
| Alert | When it appears |
|---|---|
| Scanner hit - desk filters | The stock passed every filter on your filters row. Announced once per stock per session. |
| High Rel Vol - 5min 5x | Volume over the last 5 minutes is at least five times the normal pace for that time of day. |
| Squeeze - Up 5% in 5min | The price rose 5% or more in 5 minutes on real volume. |
| Squeeze - Up 10% in 10min | The price rose 10% or more in 10 minutes on real volume. |
| New High of Day | A new high for the day on a stock that has gapped up. |
| Former Momo Stock | A stock that was a mover on an earlier day is active again. |
| HALTED / RESUMED | The stock was halted, or trading resumed. Halts are always shown, whatever the filters say. |
Row colours
| Colour | Meaning |
|---|---|
| Green text | The stock is gapped up 20% or more. |
| Green background | You hold a position in it. |
| Purple background | A news headline arrived for it recently. |
| Dark red background | You hold locates for it. |
| Yellow background | Halted. |
| Red background | Close to its limit-up / limit-down band. |
| Grey text | No fresh price recently. |
Halted stocks
When a stock is halted, its Live cell and the strip on the trading panel switch to the halt view, and the desk refuses new entries on it (open positions can still be closed).
| Shows | Meaning |
|---|---|
HALTED | Halted, with no quote or auction price yet. |
HALT ~4.15 (4.10x4.20) | Halted, with the latest bid and ask, and the middle of the two. |
HALT auct 4.18 (4.10x4.20) | Halted, with the auction price from the exchange's imbalance messages, when your data feed sends them, followed by the bid and ask. |
When trading resumes the normal price comes back. See halt rules for what the desk can do with a position during a halt.
Float, and why it carries a date
Float is how many shares are actually available to trade — the shares outstanding, less the ones that are locked up. On a fast small-cap it is often the single number that explains why a stock moves the way it does.
No market-data feed publishes it. Neither does the SEC, in the form you would want: the only float figure in SEC filings is a dollar value reported once a year, and across the whole market its median age is well over a year. A figure that old is not a float, it is a memory.
So AutoScanTrade derives it, from filings that are recent, free and public:
The share count comes off the cover page of the company's own filings. The insider holdings come from Forms 3, 4 and 5 — the ones directors, officers and ten-percent holders must file within two business days of trading their own stock.
The age is part of the number
The cell reads 1.04M 33d: an estimated float of 1.04 million shares, from a share count filed 33 days ago. The age is not decoration. A share count from before an offering describes a company that no longer exists, and there is no way to tell from the figure alone — only from its date.
Past 120 days the row's text turns red. The figure is still shown, because a stale estimate you can see beats no estimate at all. It is marked because at that age an offering could have happened without being in it. A position you are holding keeps its own colour: the fact that you are in the trade matters more than a caveat about one column.
| The cell says | What that means |
|---|---|
1.04M 33d | An estimated float of 1.04 million shares. The share count behind it was filed 33 days ago. |
14.59B 57d | The same, for a large company, in billions. |
12.85B 255d | Shown, and the row is red: the share count is more than 120 days old. |
n/a | Nothing usable has been filed, the company does not file with the SEC, or a check below refused the figure. |
When the desk refuses to show a number
An estimate that is wrong is worse than no estimate, because you would act on it. Five checks sit between the filings and the column, and each one exists because a real company broke the arithmetic:
- An options grant is not a shareholding. A Form 4 can report only derivatives — options, warrants — and carry no common-stock line at all. Read as "this insider holds zero", it erases a real holding: one issuer came out as 100% free float when insiders in fact held about half. Those filings are skipped.
- Old totals are in old shares. Anything filed more than two years ago is ignored. Before a reverse split the share counts are in a different basis entirely, and an insider who has left never files to say so — walking the whole history produced a negative float.
- A float of zero or less is refused outright. That is what catches a split inside the two-year window, which the age cut cannot see. The column reads
n/arather than a wrong number. - A number that is not a number is refused. Filings data can carry blanks and placeholders where a figure should be. A cell reading
nanlooks like a figure;n/ais a statement about what is known. - An old share count is shown and marked, never hidden. See above.
It is information, not a filter
Nothing sizes, prices, refuses or triggers an order from this figure. There is no float filter and no float gate anywhere in the desk: the column is there so you can see what you are looking at. If you keep your own float figures in the desk's float file, yours are used instead — a number you typed beats one the desk derived.
The gappers window gets the same column, with the same mark.
Where the figures come from
Straight from the SEC's own public interfaces, on a background thread, for the symbols you are actually watching — the armed symbol first, then your watchlist, then what is on the scanner. It needs no account, no key and no subscription, it never runs on the price or order path, and it stays well inside the SEC's published request limit.
Two things follow from that, and both are the honest version rather than the flattering one. The figure is an estimate, not a vendor float, and the desk says so on screen when it works one out. And it covers companies that file with the SEC: for anything else the column reads n/a.
Where a stock files from
When you arm a symbol, the live price carries a badge: TNON [US] @ $5.42 (live), or [Israel], or [China]. It is the country on the company's own filings — not a guess from the ticker.
A company with no country on file, which happens with some ADRs, shows its state of incorporation instead, marked as such: [Cayman Islands inc]. A blank badge means one thing only — the filings have not been read for that symbol yet.
Top gappers
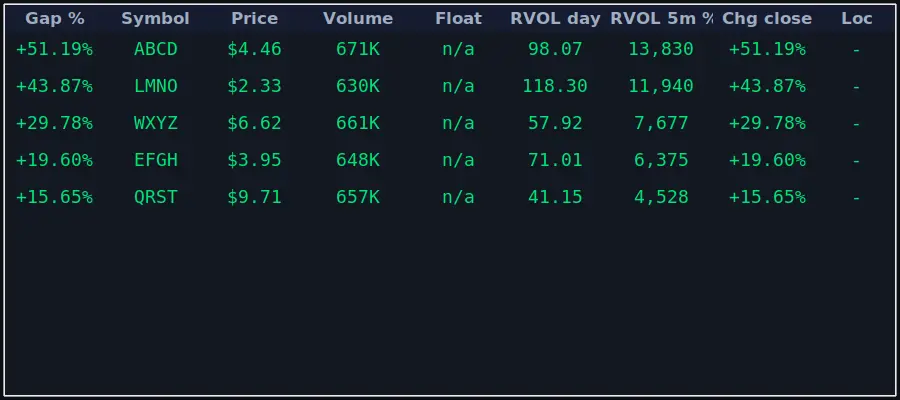
The GAPPERS window lists the biggest gappers that pass the same filters, sorted by gap. Double-click a row to arm it. Automation can also use this list (Top gappers only).
Watchlist
The WATCH window tracks stocks you choose, whatever the scanner filters say. +ADD ARMED adds the armed stock; REMOVE or the Delete key drops the selected one. Columns: symbol, locates held, price, change in the window, volume in the window, relative volume in the window and gap.
New highs
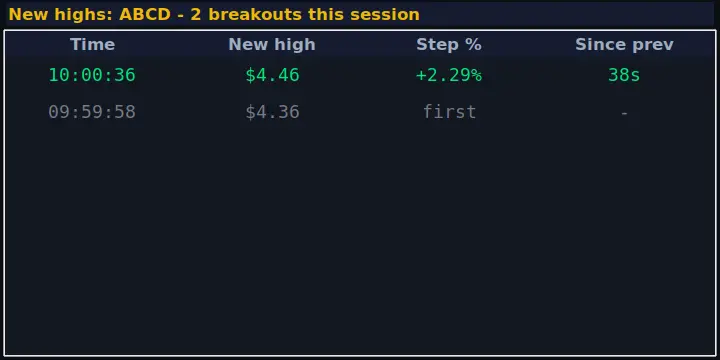
The HIGHS window shows the armed stock's breakout history for the session: each new high, the step from the previous one and the time since it. It shows how a run is pacing.
News
The NEWS window shows the latest headlines for the armed stock: time, age, source and headline. Double-click a headline to open the article in your browser. A scanner row turns purple when a headline arrives for that stock.
Two things feed it. Headlines come from the news stream on your market-data key. SEC filings come straight off the SEC's own public feed, as they are published, for the symbols you are watching — and the ones in the offering family are the reason to watch at all: a share sale announced mid-move is the thing that ends the move. Those arrive marked, and the purple band on the scanner row is the same signal from the corner of your eye.
Both go into the same list, newest first, and they do not overwrite each other. A filing that arrives while you are arming the symbol is still there when you open the window to find out what happened.